
This is a blog series about optimizing my energy consumption with IoT-TICKET®. Basically I am controlling the energy load of my house as optimal as possible taking electricity price, own solar energy production and weather conditions into consideration. This series will include posts about how the idea developed and how it was implemented technically. There will be several posts about this topic and the first one is about how this project started.
Idea develops
I have always done many kind of computer and electronic projects as my hobby. For example when my house was built in 2004, I made all kind of sensors (temperature, humidity), weather stations (wind, pressure, rain), digital TV etc. to my house with Linux. And because I am a Wapice Employee, I have a kind of work benefit to use Wapice’s Internet of Things platform, IoT-Ticket to my free time projects. I have also used IoT-Ticket for my caravan which is located in Lapland. IoT-Ticket has a very important role in my projects, because with it, it’s super easy to develop all my ideas in short time.
This story began in autumn 2016, when I ordered a chargeable plugin hybrid car. When I decided to have such a car, I wasn’t thinking much what it really means to charge an electric vehicle at home, but now I know a lot about it. After placing a car order, there was a lot of time to think about charging and how it will be arranged. I also started to wonder how much it costs and how can I optimize the costs.
I have always had a sort of passion to electronic projects and now, when the kids are older, I made a personal decision to use more time to my free time projects. I encouraged my mind and ordered one Wapice WRM247+ device from my colleague.
In autumn 2006, it was one productive Sunday when I mounted WRM247+ device to my home with couple of temperature sensors and couple of energy meters (one for house and another one for car charger). Then I implemented two python scripts. One reads daily electricity prices/hour from Nord pool and another one reads the weather forecast utilizing Finnish meteorological institute open data. After that, the data is written to IoT-Ticket. At that point, I knew that with IoT-Ticket Flow programming language I can implement my all ideas very easily.
But that wasn’t enough. In that same Sunday I was reading information about sun energy possibilities and I thought would it be possible to produce energy at home. I found Aurinkovirta page very interesting because there people were ordering PV parts like inverters, solar panels and solar panel mounting equipment together. The project started to progress fast; I ordered 24 solar panels with mounting equipment (40m2 total 6kWp) and PV (photovoltaic) inverter. The mounting of panels happened just before winter and after the snow melt I connected PV plant to electricity grid.
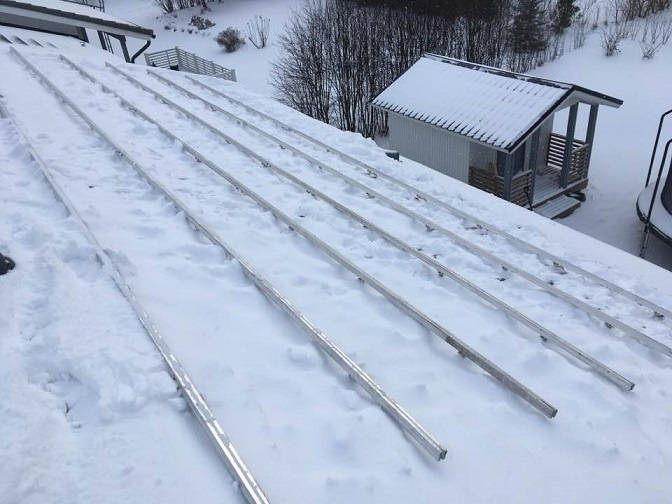
Figure 1. There was some challenges to mount panels by the end of November 2016.
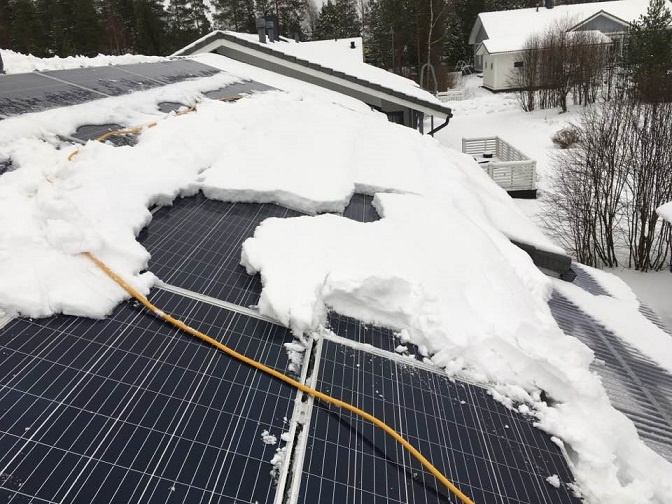
Figure 2. After all, the panels were mounted and in March 2017 it was time to clean some snow and connect the PV plant to the grid.
Dashboards
Wapice’s IoT-Ticket is a tool like Power Point or Word, but with big data enabled. With IoT-Ticket it is super easy to develop all kind of visual dashboards. Now I have a lot of information about the electricity behavior of the house and I just need to think what to do with that data. With IoT-Ticket the data can be manipulated or control functions can be developed by easy block based programming language called Data Flow. With Data Flow I can also do many kinds of calculations and controls. But I was progressing stepwise and at first I created some simple dashboards to understand how electricity behaves at my home:
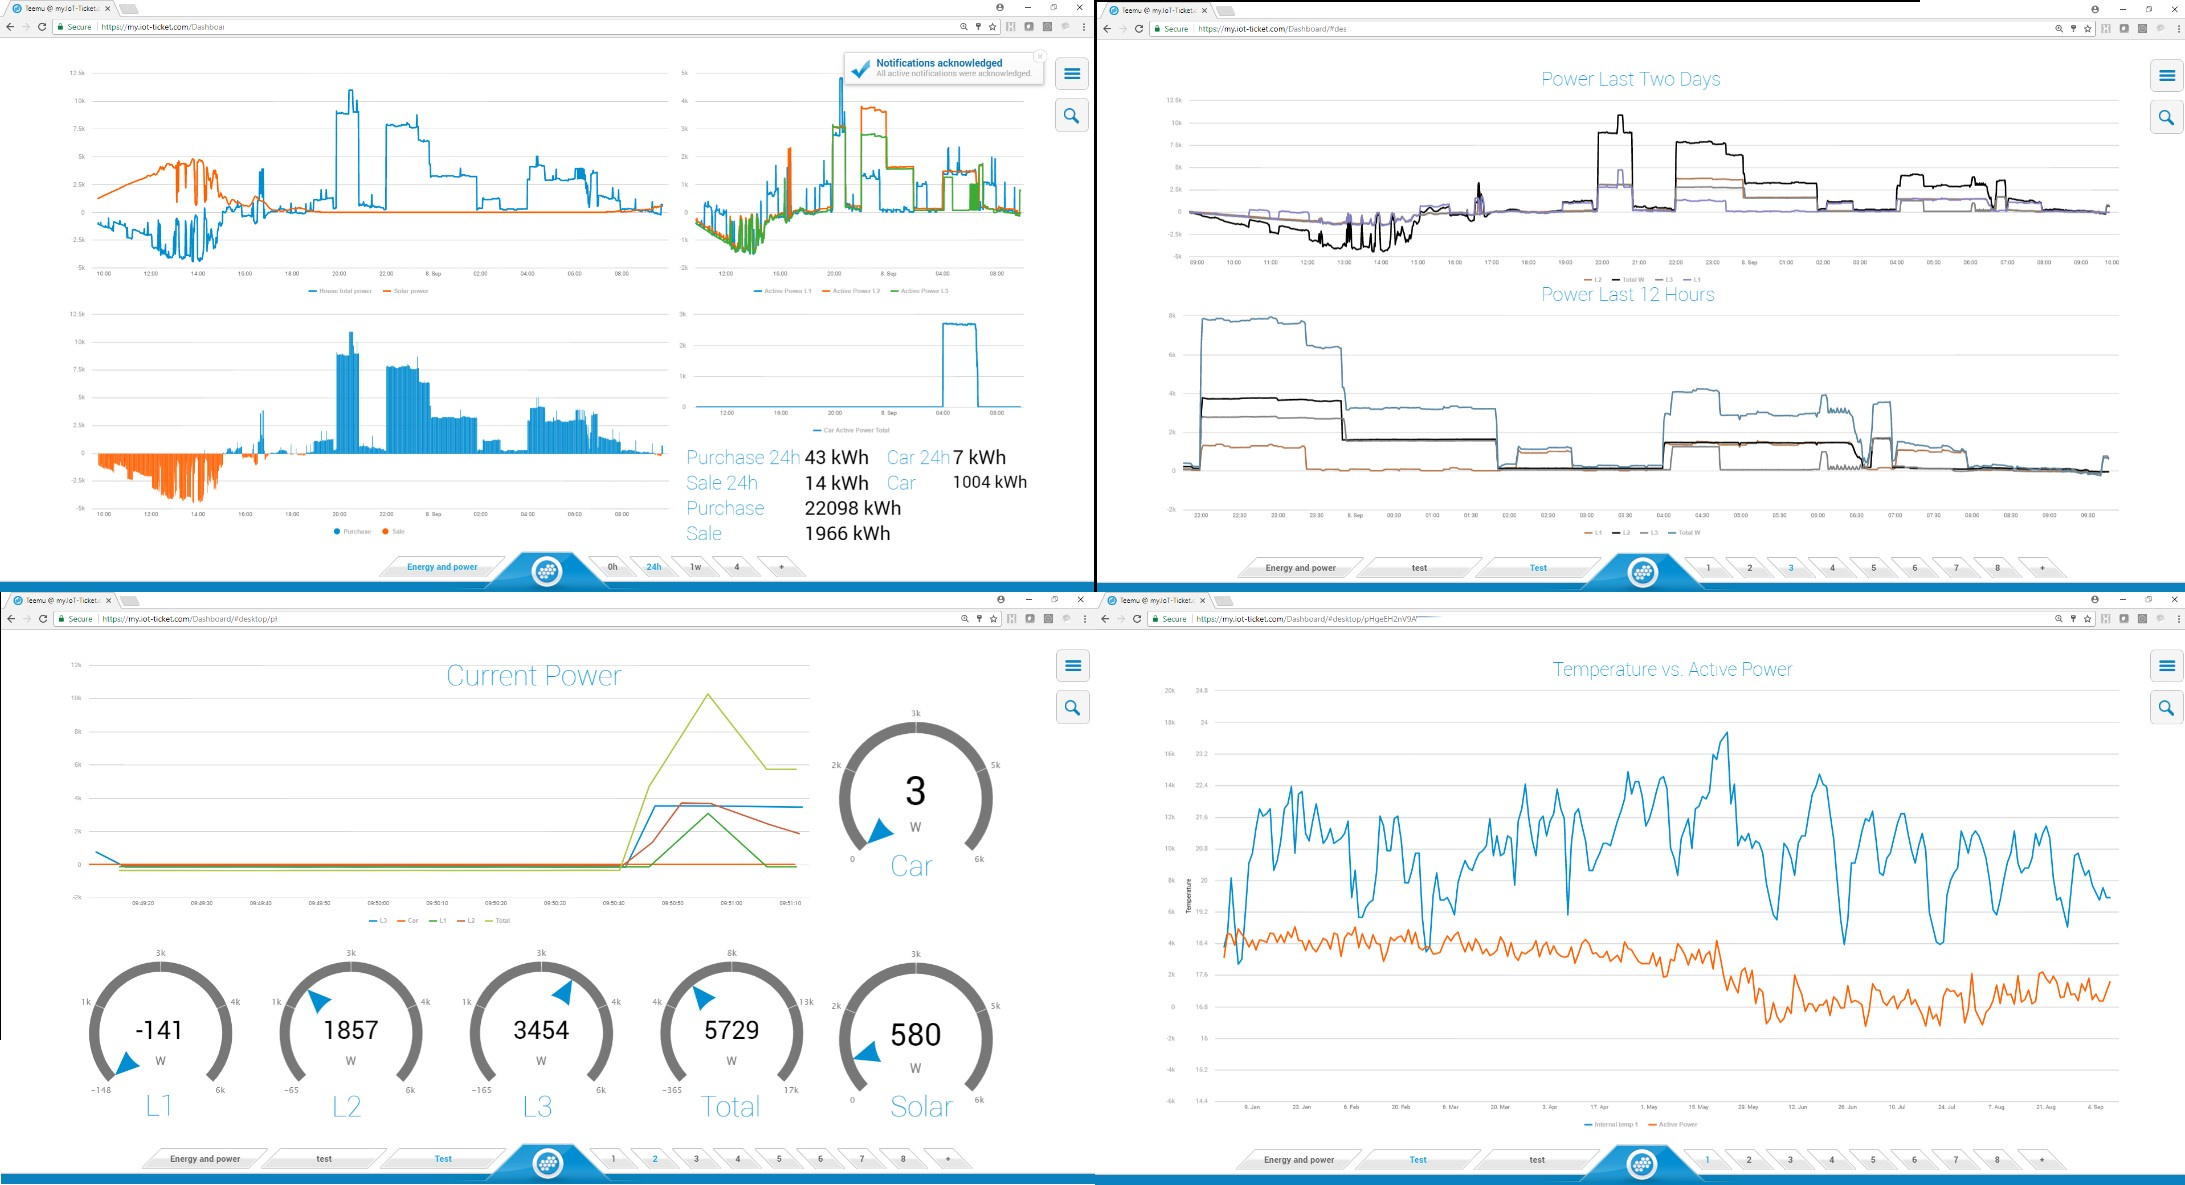 Figure 3. Some of the engineer-only dashboards (I have almost 20 of them).
In March 2017 I connected PV (photovoltaic) inverter (a device which converts DC electricity to three phase AC electricity) to electricity grid. I am now selling solar energy what I am not using to the electricity utility. For that use I created following dashboard:
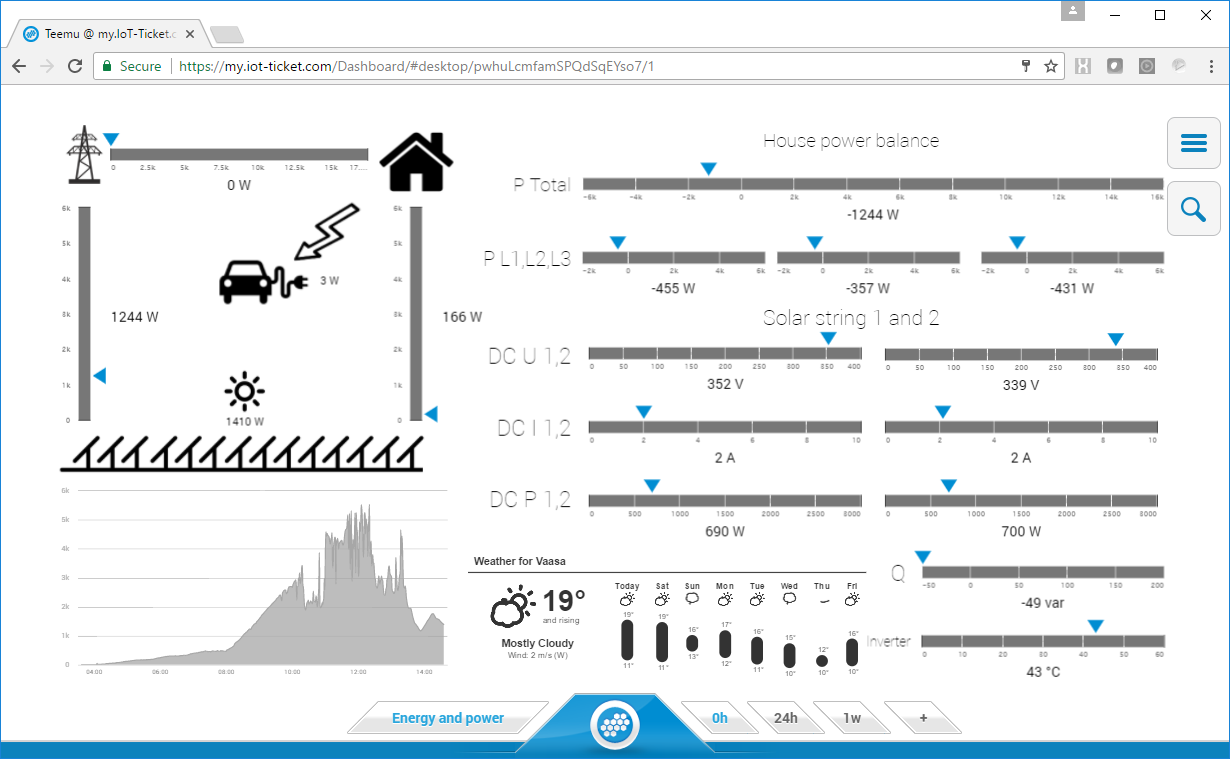 Figure 4. Left side of the Dashboard should be easy to understand, right side has some details about Solar strings.
The upper left part of the picture above, is one important picture when optimizing the energy load of the house. It has some own electricity production:
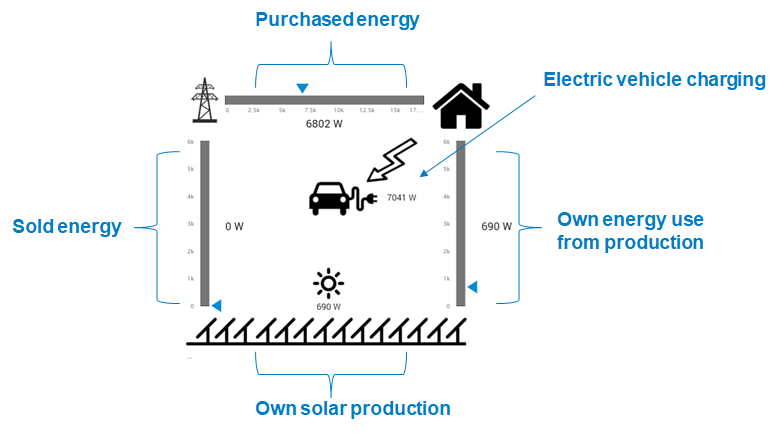
Figure 5. Energy Balance of the house.
I have created these dashboards mainly for my own use to understand what happens in the system I am going to optimize. I asked my wife what information she would like to get from the system, so that is what I need to do someday:
- Overall economy
- Price / consume (electricity import)
- Price / sell (electricity export)
- Development of energy consumption
- How much solar power is utilized?
- Concrete prices: What is the consumption on low energy price vs. high energy price?
- Solar energy: How much is sold vs. used by own (well this can be seen already, but maybe I should do some non-engineer Dashboards)
- When the washing machines should be turned on? In the next day or night time, when the spot of electricity is low.
For me this is a hobby, I haven’t made any calculation (yet) whether any cost savings is achieved or not, but thank god my wife is reminding me about that.
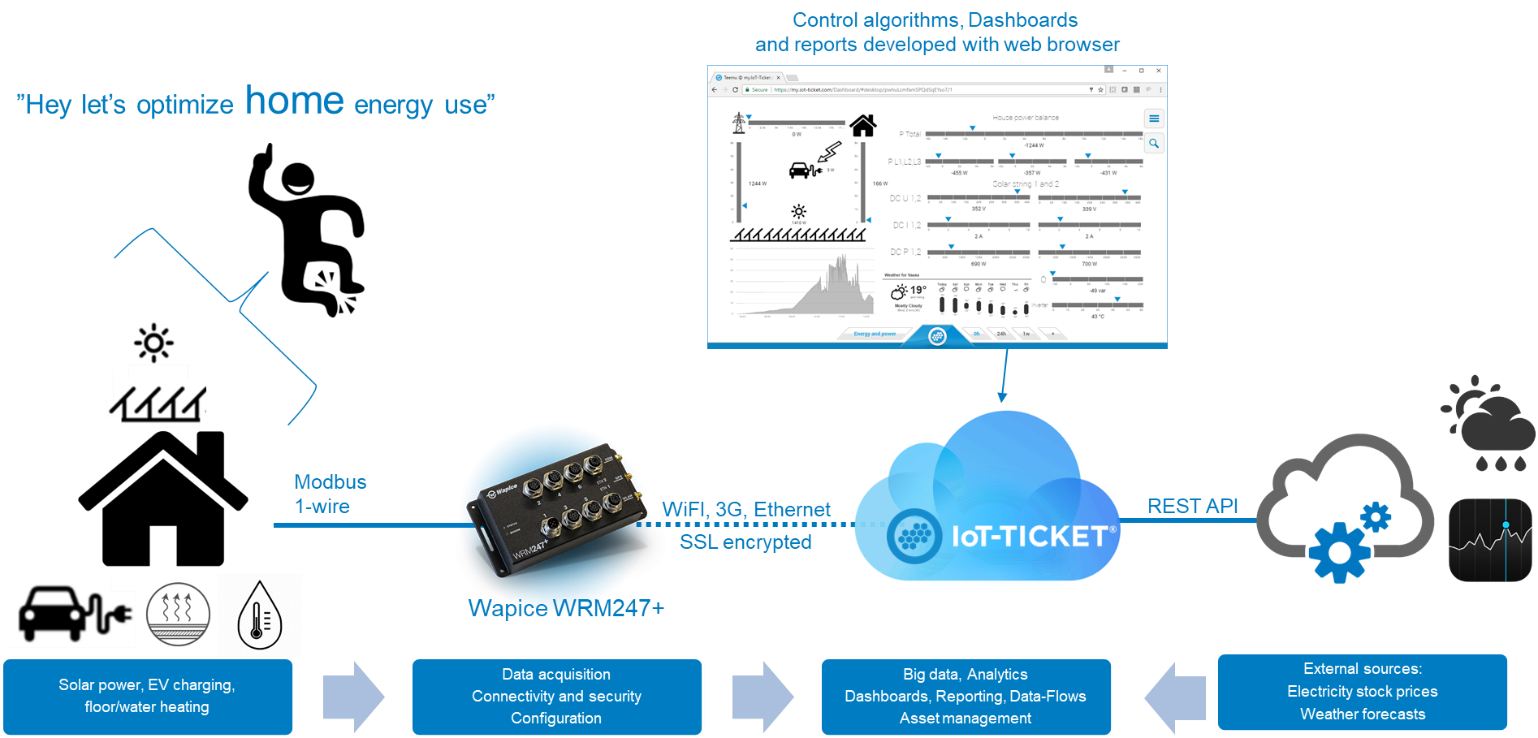 Figure 6. Overall architecture of the system.
The story will continue on next blog post where I'll write about my new hybrid car and how the charging can be optimized.